Nasir A Siddiqui, Ramzi A Mothana, Perwez Alam
Department of Pharmacognosy, College of Pharmacy, King Saud University, PO Box 2457, Riyadh 11451, Saudi Arabia;For correspondence:- Nasir Siddiqui Email:
Received: 24 March 2016 Accepted: 23 July 2016 Published: 30 August 2016
Citation: Siddiqui NA, Mothana RA, Alam P. Quantitative determination of alliin in dried garlic cloves and products by high-performance thin-layer chromatography. Trop J Pharm Res 2016; 15(8):1759-1765 doi: 10.4314/tjpr.v15i8.23
© 2016 The authors.
This is an Open Access article that uses a funding model which does not charge readers or their institutions for access and distributed under the terms of the Creative Commons Attribution License (http://creativecommons.org/licenses/by/4.0) and the Budapest Open Access Initiative (http://www.budapestopenaccessinitiative.org/read), which permit unrestricted use, distribution, and reproduction in any medium, provided the original work is properly credited..
Purpose: To standardize the garlic samples and its products for alliin contents.
Methods: A direct high-performance thin-layer chromatographic (HPTLC) method was developed to determine alliin in Chinese (CG) and Indian garlic (IG) and two other marketed products from USA and UK, respectively. Scanning and quantification were performed at 205 nm. Furthermore, chromatography was performed on pre-coated HPTLC plates with the solvent mixture, n – hexane:ethyl acetate (29:1 v/v), as the mobile phase. In addition, the parameters suggested by International Conference on Harmonization for analytical procedures were considered to validate the proposed method.
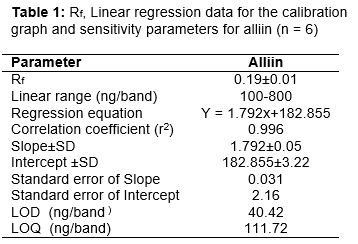
Results: The system gave a compact spot of alliin at RF = 0.19 ± 0.01 The linear regression data for the calibration plots showed a good linearity (r2 = 0.996) in the concentration range of 200 - 1600 ng. Linear regression equation was represented by Y = 1.792x + 182.855, while LOD and LOQ values were 40.42 ngband-1 and 111.72 ng.band-1, respectively. The method showed excellent accuracy with recovery of 98.20 – 99.10 % and good precision with RSD of 1 - 2.65 %.
Conclusion: The proposed method is selective, sensitive and accurate for the determination of alliin in garlic and its products. It is also evident from the results obtained that raw Indian garlic has higher alliin content than Chinese garlic.
Introduction
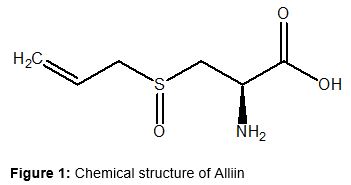
Garlic (Allium sativum) is an important culinary and medicinal plant which possesses several biological activities such as antibiotic, antitumor, anti-atherosclerotic, cardioactive, etc. [1-4]. Alliin, chemically known as S-allyl cysteine sulfoxide () is the major flavor precursor in garlic. In addition to alliin, some other compounds such as isoalliin, mithiin and a trace amount of propiin are also found in garlic [5]. Alliin is the most noticeable biomarker in garlic, consist of about 10 and 30 mg/g in fresh and dry garlic, respectively [6]. The daily intake of garlic in various forms recommended by WHO is 2 - 5 mg of oil, 2 - 5 g of fresh garlic, 0.4 - 1.2 g of dry powdered garlic and 0.3 - 1 g of the dry extract [7]. As a dietary supplement, 600 - 900 mg of garlic per day is suggested by the American Dietetic Association [8].
Allicin is the therapeutically useful compound of garlic. However, it is difficult to directly determine it due to its high reactivity and unstable nature. The range of the amount of allicin in garlic samples is reported by several authors from 3.37 to 8.99 mg/g [9-11]. The quantity of alliin indicates the quality of garlic. Upon crushing of garlic cloves the enzyme alliinase get access to alliin and consequently alliin is converted into allicin with a release of characteristic aroma [12]. The reported ratio of conversion from alliin to allicin is 3:1 along with pyruvic acid, ammonia, and carbon dioxide as by-products [13].
Due to the lack of scientific data the World Health Organization (WHO) has given the emphasis for the evaluation of the effectiveness of plant-based drugs [14]. Several methods of analyses for alliin such as spectrophotometry [15], gas chromatography [16], capillary electrophoresis [17], spectrophotometric methods [18], high performance liquid chromatography [19] and high performance thin layer chromatography [20-22] have been proposed. In recent years, due to low operation cost and high sample throughput, HPTLC gained much acceptance for its analytical interventions in herbal drugs and formulations. [23]. The increasing demand for natural drugs motivated the authors to perform this study in order to provide an easier and sensitive tool for quality control units of herbalists. The validation of the proposed method was performed as per the International Conference on Harmonization (ICH) guidelines [24].
Methods
Material
The raw garlic samples were collected from Jining (Shandong), China and Indore (M.P.) in India which is very well known places for the production of good quality of garlic and the tablet samples from the market. Material to be studied was identified by Dr. Mohammed Yusuf, Field taxonomist, Medicinal Plant Collection and Survey Unit, Department of Pharmacognosy, College of Pharmacy, King Saud University, Saudi Arabia. Specimens of the studied material were deposited in the herbarium, Department of Pharmacognosy, College of Pharmacy, King Saud University, Saudi Arabia.
Apparatus and reagents
Standard alliin (HPLC grade) was obtained from Sigma-Aldrich (CAS Number 17795 - 26- 5). Reagents and solvents of analytical grade (Ethyl acetate, n - hexane, ninhydrin etc.) were purchased from Fluka Chemicals (Busch, Switzerland) and Across Organics (Hamilton, NJ), respectively. Pre-coated HPTLC glass plates of silica gel 60 F254 were purchased (E. Merck, Darmstadt, Germany). The application of standard and the extracts were made on HPTLC plate band wise with the help of CAMAG automatic TLC sampler-4 and developed in automatic development chamber-II (CAMAG, Muttenz, Switzerland). Scanning and documentation of developed HPLTLC plate were done by CATS 4 and CAMAG TLC Reprostar 3, respectively. A standard stock solution of alliin (1 mg/mL) was prepared by dissolving 10 mg of standard in 10 mL dichloromethane. One milliliter of the stock solutions was again diluted to 9 mL of dichloromethane to get the concentration of 100 μgmL-1. For making calibration graph, 2 - 16 µL of the standard solution was applied to HPTLC plate to provide concentration range of 200 - 1600 ngband-1.
Sample preparation
Fresh garlic samples were weighed and dried in the sun. Dried garlic samples of 465 mg and 320 mg of Chinese and Indian garlic, respectively were powdered and extraction was made with 10 ml of dichloromethane by vigorous stirring for 30 s. The extraction procedure was repeated twice. Similarly, one tablet from each brand was weighed [Avg Wt. 603 mg (US) and 550 mg (UK)], crushed and extracted twice with the similar procedure. All the four extracts were dried by vacuum evaporation of the solvent and percentage yield was calculated. Dried extracts from each sample was dissolved in 10 ml of dichloromethane and filtered through a 0.45 µm filter membrane to make a stock solution for HPTLC analysis. One ml of this stock solution was mixed with 9 ml of dichloromethane to perform the analysis. After optimizing the method, 2 µl from all the four samples were applied for analyses. The samples were quantified against the standard alliin used for the calibration curve.
Instrumentation and chromatographic conditions
The analytical procedure was performed on HPTLC glass plates of size 20 × 10 cm coated with silica gel 60F254 as the stationary phase. TLC Sampler 4 (Automatic) fitted with a Hamilton Gastight Syringe (1700 Series) of volume 25 µL was used to apply the samples and standard on the HPTLC plate at an application speed of 160 nl/s. The development of spotted plate was done in a previously saturated automatic developing chamber with mobile phase n-hexane: ethyl acetate (29:1) moving in linear ascending mode.
After the development of HPTLC plate, it was air dried and sprayed with ninhydrin reagent. For further analyses, Camag TLC scanner IV was used to scan the developed and sprayed plate at 205 nm wavelength in absorbance mode by using the deuterium lamp. The slit dimensions were 4.00 × 0.45 mm and the scanning speed was 20 mm/s.
Preparation of calibration graphs
Calibration graph for standard alliin was prepared by applying a series of spots of standard with eight different volumes so as to get a different amount of alliin per spot. They were prepared with respect to height and area versus amount per spot.
Statistical analysis
All the results are presented as mean ± SEM. Comparative analysis of the results for each parameter was performed using SigmaStat® for Windows, Systat Software Inc (San Jose, CA). One-way analysis of variance (ANOVA) was used to determine significant differences between the results at p ˂ 0.05.
Method development
The chromatogram was developed for alliin by selecting the mobile phase after trying several combinations of solvents (). After optimization, the best resolution was observed in the selected mobile phase [n-hexane:ethylacetate (29:1)]. A similar mobile phase has been employed for the resolution of dichloromethane extracts of samples S1 (CG), S2 (IG), S3 (USA), and S4 (UK). The optimum saturation time was 20 min. The scanning of the plate and densitometric quantification was done at an optimized wavelength of 205 nm in absorbance mode.
Method validation
The validation of proposed method was executed as per the guidelines suggested by ICH and the linearity, precision, accuracy, LOD, LOQ and robustness were the parameters considered for validation [28].
Linearity range
For determining the linearity range of standard alliin, a series of spots of different volumes (2 µl – 16 µl) were applied so as to get the 200 – 1600 ng quantity of alliin per band. The graph was plotted between concentration and peak area for linearity. The data for linearity range was statistically treated with least square linear regression analysis.
Accuracy
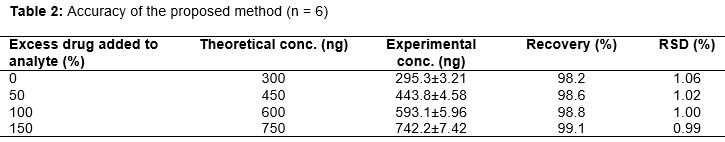
Standard addition method was used to determine accuracy. The pre-analyzed sample of alliin (300 ng/spot) was spiked with the extra 0, 50, 100 and 150 % of alliin and the solutions were reanalyzed in six replicates by the proposed. The % recovery and percent relative standard deviation (% RSD) were calculated.
Precision
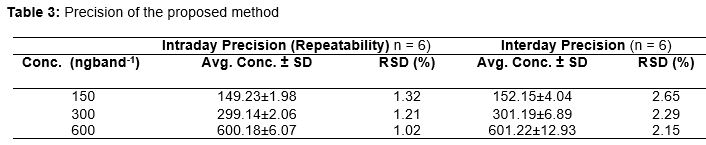
The concentration levels of 150, 300 and 600 ng/spot of alliin was used to evaluate the precision of the proposed method by replicate analyses (n=6). Inter-day precision was determined by repeating the intra-day assay on three different days.
Robustness
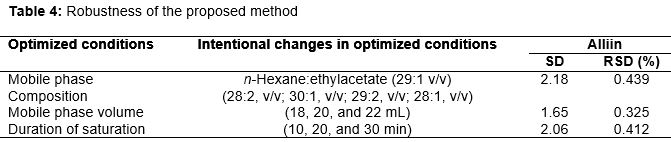
The robustness of the proposed method was evaluated in triplicate at 500 ngband-1 by introducing some deliberate changes to the composition of mobile phase, the volume of mobile phase and duration of saturation. The results were evaluated in terms of relative standard deviation (RSD %) and standard error of peak areas. Mobile phases prepared from n-hexane: ethyl acetate in different proportions (28:2, v/v; 30:1, v/v; 29:2, v/v; 28:1, v/v) were used for chromatography. The change in mobile phase volume and duration of saturation was made by 20 ± 2 mL (18, 20, and 22 mL) and 20 ± 10 min (10, 20, and 30 min), respectively.
LOD and LOQ
The calculation of LOD and LOQ was made on the basis of standard deviation (SD) of the response and the slope (s) of the calibration graph using formulae [LOD = 3.3 (SD/S) and LOQ = 10 (SD/S)].
Assay of alliin
Standard alliin and test samples (2 µl each) were spotted on HPTLC plates. The percentage of alliin present in test samples (S1 to S4) was determined by measuring the area for the standard and test samples. Thereby the percentage of alliin was calculated for all the four samples and reported in .
Results
The relation between the concentration of alliin and the corresponding peak area was linear within the range of 200 to 1600 ng/ spot. The linear regression analyses data for the calibration plot showed a good linear relationship with r2 = 0.996 with respect to the area in the concentration range of 200 - 1600 ng. The regression equation for standard alliin was found to be Y= 1.792x + 182.855. The precision values (n = 6) for alliin were found 2.15 - 2.65 % and 1.02 – 1.32 %, respectively, for inter-day and intra-day evaluation. Accuracy data in terms of % RSD was 0.99 - 1.06 and recovery 98.2 – 99.1 %. The statistical data supports the selectiveness, precision, and accuracy of the proposed method. Therefore, the developed method can be recommended for routine analysis of garlic and its products for alliin contents.
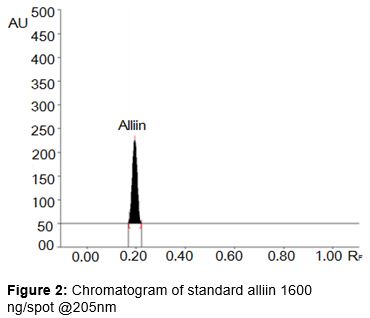
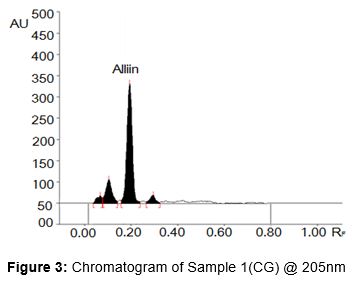
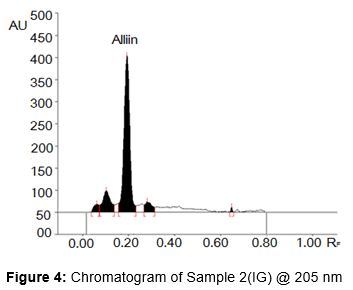
The suggested method was efficient in separating constituents present in the samples (S1 to S4) and exhibiting sharp peaks of standard (alliin) with the selected mobile phase under chamber saturation conditions at a wavelength of 205 nm in absorbance mode. The mobile phase n - hexane:ethyl acetate (29:1 v/v) was found to furnish a sharp peak of alliin at Rf values 0.19 ± 0.01 (). The developed method was found to be quite selective with good baseline resolution.
The calibration curve for alliin was linear in the range of 200 – 1600 ng/spot and a good linear relationship was verified by linear regression data for the plot (). The correlation coefficient (r2) for alliin was 0.996 and found to be significant (p < 0.05). The linear regression equation was Y = 1.792x + 182.855 where Y is a response and X is the quantity of reference standard. The accuracy was determined by recovery analysis which afforded recovery of 98.20 - 99.10 %, and the different values are listed in . Low values of RSD 0.99 - 1.06 % indicated the excellent accuracy of the proposed method. RSD was in the range 1.02 - 1.32, 2.15 - 2.65 %, respectively for intra-day and inter-day precision which indicated good precision of the proposed method ().
The observations of robustness are shown in . Low values of RSD (0.325 - 0.439 %) proved the robustness of the proposed HPTLC method. LOD & LOQ (Table I) of the proposed method were found to be 40.42, 111.72 ng/spot which suggested that the proposed method might be used in a broad range for detection and quantification of alliin.
Alliin content of prepared samples
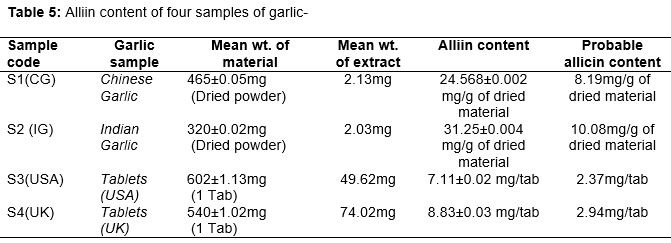
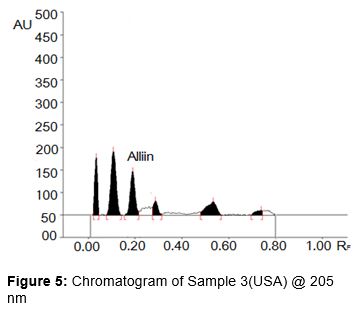
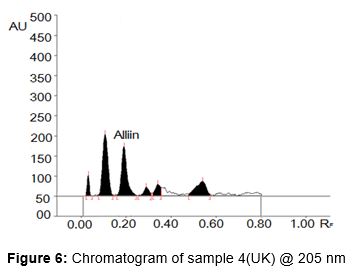
The proposed method was exploited in the quantification of alliin in samples S1 (), S2 (), S3 () and S4 (). Despite applying the same volume the peak size and area of a chromatogram of the sample, S2 was found to be highest in all the samples analyzed.
The quantity of alliin was found to be 24.568 mg/g and 31.25 mg/g of dried powder of Chinese (S1) and Indian garlic (S2) respectively. The Alliin content in two tablet samples of U.S.A. (S3) and U.K. (S4) possess 7.11 and 8.83 mg/Tab, respectively. The content of alliin evaluated in the different samples is given in .
Discussion
Garlic is an integral part of our daily diet and one of the most useful functional foods in the world. Unfortunately the methods of handling the garlic directly affect its therapeutic ability. Most of the garlic products do not indicate the actual amount of active ingredients supposed to be released from the preparation. This is one of the reasons why we need a simple and sensitive method for routine analysis of quality of garlic and its products. Till now many methods for the quantitative analysis of alliin was proposed but all these methods are complex and usually have an indirect determination of alliin or allicin.
The findings of present study offer a simple and direct method of quantification of alliin which is a relevant marker for quality control of garlic and garlic products. The statistical data for precision, specificity, sensitivity, and accuracy support the recommendation of this method for routine assessment of garlic and its preparation. Though allicin is medicinally more valuable than alliin but it is highly unstable compound, and no measurable quantity of allicin is present in whole garlic cloves. Therefore, quantification of alliin in garlic preparations justify the way of standardization of herbal products as well as raw garlic. The results of this experiment strongly support that the recommended dose of garlic tablets considered in this analyses possess enough amount of alliin (as recommended by WHO) being taken for a healthy heart [7]. As far as alliin contents are concerned the dried raw garlic appears as a better option than marketed garlic products but needs to be careful with the low release of allicin from alliin at acidic pH.
Conclusion
The findings demonstrate that Indian garlic sample possesses slightly higher concentration of alliin than Chinese garlic. The marketed products usually do not indicate the concentration of active ingredients, a method for quantifying alliin in marketed garlic products has been developed. The garlic products evaluated contain the therapeutically required amount of alliin in prescribed serving size of the formulations. Thus, the proposed method can be used for routine analysis and standardization of raw garlic as well as garlic products for alliin contents.
Declarations
Acknowledgement
References
Archives


News Updates